Himawari Securities, Inc.
Fundamentals Map
 A "fundamentals map" is the first fundamentals analysis tool in the FX industry This tool powerfully supports you extracting the economic index and background of a market price change immediately,, and predicting the influence degree to the market price of that index.
http://sec.himawari-group.co.jp/report/zmap/
- <Features>
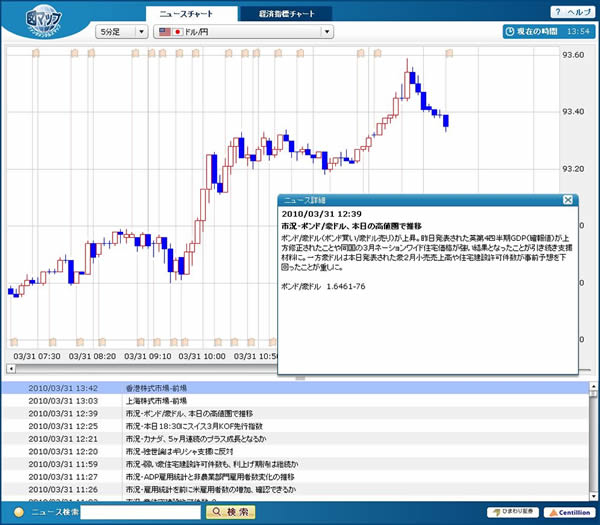
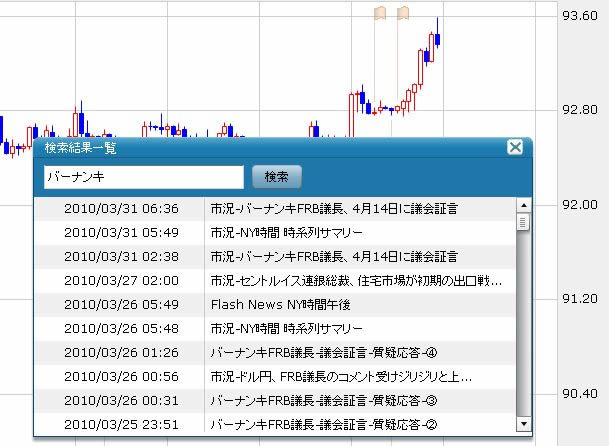
- ●News chart
- It displays timing which news was distributed with a flag on a chart screen. By clicking the flag of the market price,you can check the news, and background of price change.
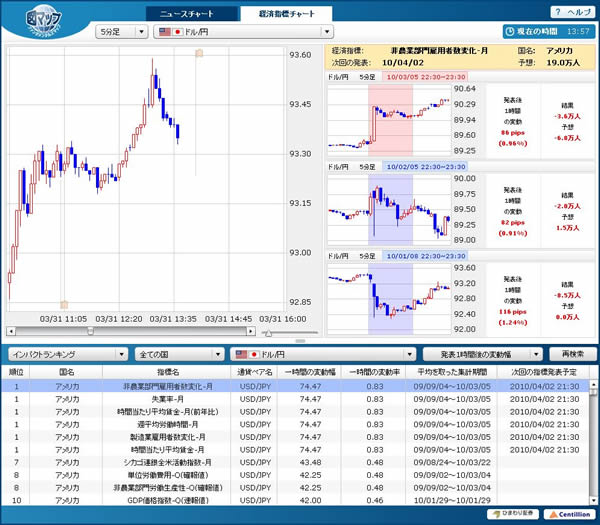
- ●Economic Index chart
- It shows the timing of an economic index announcement with flags on a chart screen.
when you click a flag, you can check actual range of fluctuation (pips) and rate of market price change within 1hour when the same economic index was announced in the past.
Moreover, it can also indicates range of fluctuation and the rate of market price change after announcing economic index in the ranking form .
It makes you easy to find economic index which moves a market price.
We realized the release of this system for a short period "3 months" by customizing our product (our general chart engine) in development of this chart system.